
【PHP】PHP7 下安装并使用 xhprof 性能分析工具
该 xhprof 版本是从 https://github.com/longxinH/xhprof 获取
git clone https://github.com/longxinH/xhprofcd xhprof/extension/
phpize
./configure
make
make install然后在/etc/php.ini中根据情况加入
extension=xhprof.so执行
php -m | grep xhprof可以看见输出,说明php扩展安装成功,然后重启Apache或者php-fpm
可以直接运行从github上clone下来的文件里面example目录下的那个例子
输出如下
Array
(
    [main()] => Array
        (
            [ct] => 1
            [wt] => 9
        )

)
---------------
Assuming you have set up the http based UI for
XHProf at some address, you can view run at
http://<xhprof-ui-address>/index.php?run=592567308784c&source=xhprof_foo
---------------
然后复制index.php后面的?run=592567308784c&source=xhprof_foo
访问
xhprof_html/index.php?run=592567308784c&source=xhprof_foo可看见输出
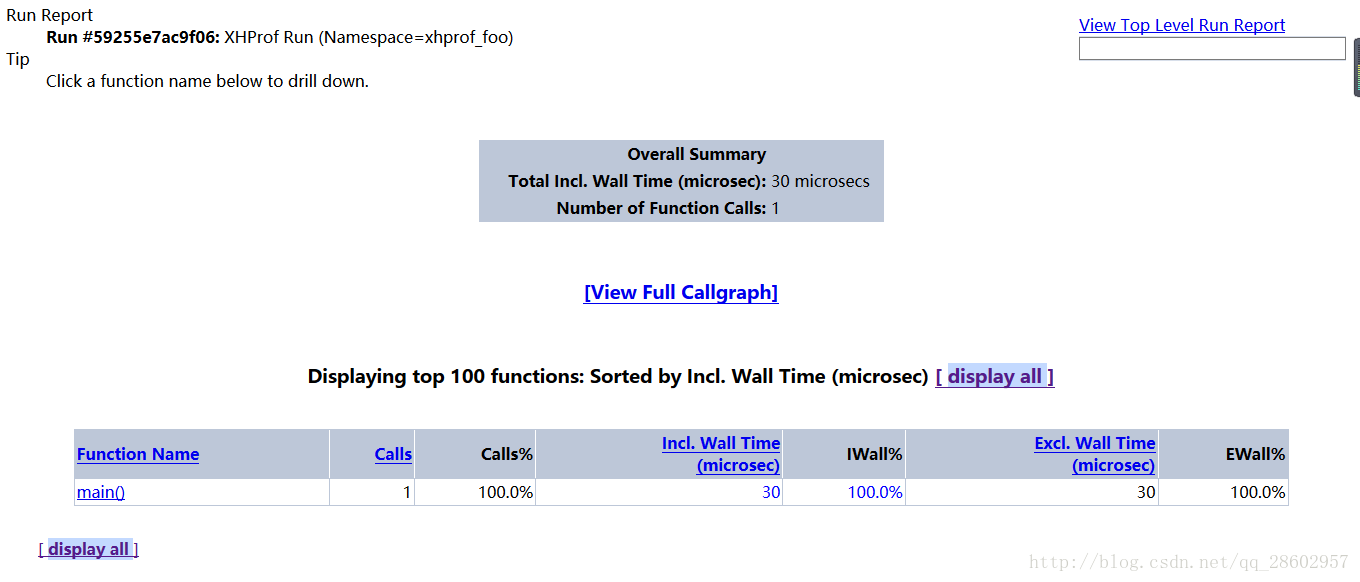
点击中间的 View Full Callgraph 即可看见性能分析图片
failed to execute cmd:" dot -Tpng". stderr:sh: dot:command not found。//解决方案
yum install graphviz比如想测试自己的项目,例如一款框架的性能分析。
复制xhprof_lib/utils/下的两个文件
xhprof_lib.php和xhprof_runs.php到入口文件同级目录,然后在入口文件起始位置添加
// start profiling
xhprof_enable();
结束位置添加
// stop profiler
$xhprof_data = xhprof_disable();

// display raw xhprof data for the profiler run
print_r($xhprof_data);


include_once "xhprof_lib.php";
include_once "xhprof_runs.php";

// save raw data for this profiler run using default
// implementation of iXHProfRuns.
$xhprof_runs = new XHProfRuns_Default();

// save the run under a namespace "xhprof_foo"
$run_id = $xhprof_runs->save_run($xhprof_data, "xhprof_foo");

echo "---------------
".
     "Assuming you have set up the http based UI for
".
     "XHProf at some address, you can view run at
".
     "http://<xhprof-ui-address>/index.php?run=$run_id&source=xhprof_foo
".
     "---------------
";
即可得到如上所示的那个url,然后再次去访问
http://***/xhprof_html/index.php?run=*****&source=xhprof_foo得到如下所示页面
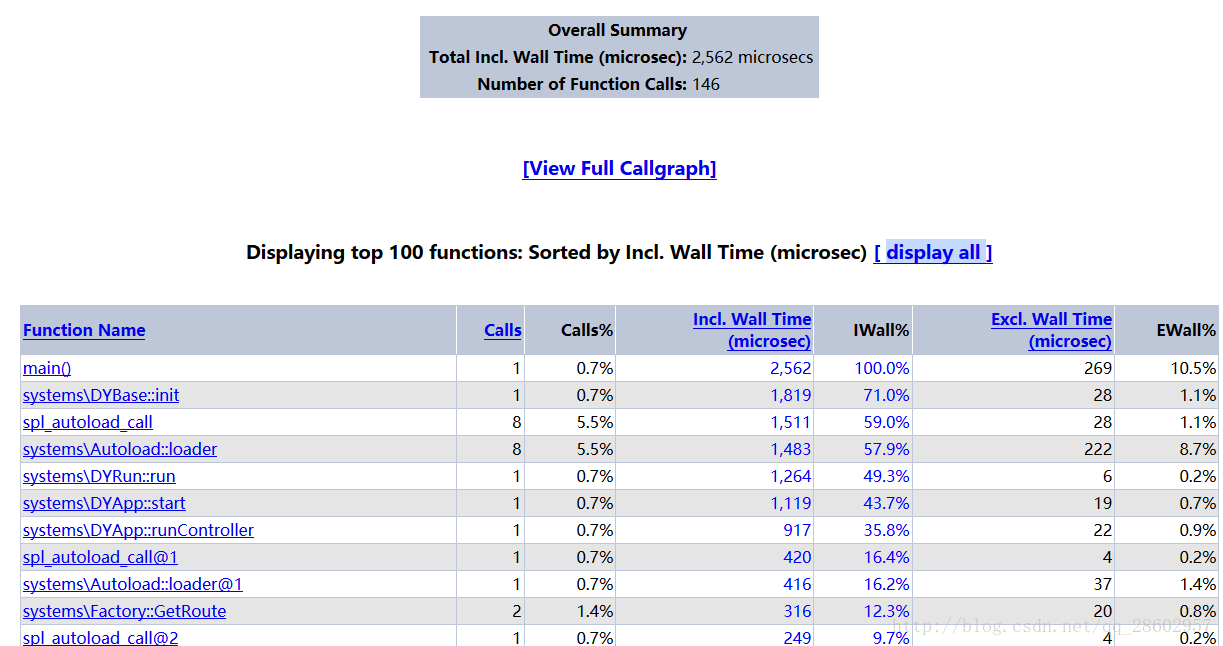
查看图片
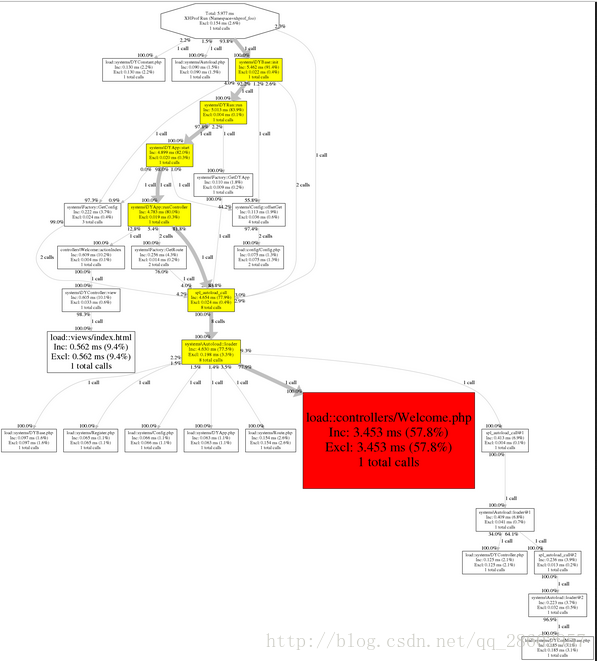
图中红色的部分为性能比较低,耗时比较长的部分,我们可以根据根据哪些函数被标记为红色对系统的代码进行优化
    Function Name:方法名称。

    Calls:方法被调用的次数。

    Calls%:方法调用次数在同级方法总数调用次数中所占的百分比。

    Incl.Wall Time(microsec):方法执行花费的时间,包括子方法的执行时间。(单位:微秒)

    IWall%:方法执行花费的时间百分比。

    Excl. Wall Time(microsec):方法本身执行花费的时间,不包括子方法的执行时间。(单位:微秒)

    EWall%:方法本身执行花费的时间百分比。

    Incl. CPU(microsecs):方法执行花费的CPU时间,包括子方法的执行时间。(单位:微秒)

    ICpu%:方法执行花费的CPU时间百分比。

    Excl. CPU(microsec):方法本身执行花费的CPU时间,不包括子方法的执行时间。(单位:微秒)

    ECPU%:方法本身执行花费的CPU时间百分比。

    Incl.MemUse(bytes):方法执行占用的内存,包括子方法执行占用的内存。(单位:字节)

    IMemUse%:方法执行占用的内存百分比。

    Excl.MemUse(bytes):方法本身执行占用的内存,不包括子方法执行占用的内存。(单位:字节)

    EMemUse%:方法本身执行占用的内存百分比。

    Incl.PeakMemUse(bytes):Incl.MemUse峰值。(单位:字节)

    IPeakMemUse%:Incl.MemUse峰值百分比。

    Excl.PeakMemUse(bytes):Excl.MemUse峰值。单位:(字节)

    EPeakMemUse%:Excl.MemUse峰值百分比。
声明:该文观点仅代表作者本人,入门客AI创业平台信息发布平台仅提供信息存储空间服务,如有疑问请联系rumenke@qq.com。
- 上一篇: PHP文件处理的高级应用
- 下一篇: Yii2数据库查询有关的操作