<!DOCTYPE html>
<html>
<head>
<script src="js/d3.min.js" type="text/javascript" charset="utf-8"></script>
<script src="js/jquery-1.11.3.min.js" type="text/javascript" charset="utf-8"></script>
<meta charset="utf-8">
<title></title>
</head>
<body>
<svg></svg>
<script type="text/javascript">
var svg = d3.select("svg");
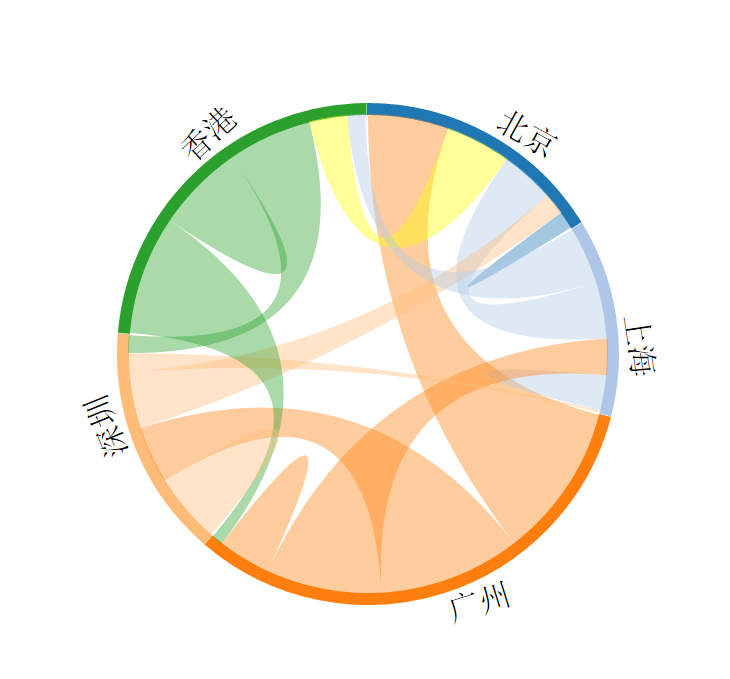
var city_name = [ "北京" , "上海" , "广州" , "深圳" , "香港" ];
var population = [
[ 1000, 3045 , 4567 , 1234 , 3714 ], //北京本地1000人,上海来的3045人,4567是广州来的,1234是深圳来的,3714是香港来的
[ 3214, 2000 , 2060 , 124 , 3234 ],
[ 8761, 6545 , 3000 , 8045 , 647 ],
[ 3211, 1067 , 3214 , 4000 , 1006 ],
[ 2146, 1034 , 6745 , 4764 , 5000 ]
];
/*定义布局*/
var chord_layout = d3.layout.chord()//
.padding(0.1) //节点之间的间隔(这个间隔反正不能太大了,只能在1以内)
.sortSubgroups(d3.descending) //排序(每组顺序内部排序,顺时针排列还是逆时针排列)
.matrix(population); //输入矩阵 //相当于数据绑定吧
var groups = chord_layout.groups();
var chords = chord_layout.chords(); //代表中间显示的那些线条
var width = 400; //svg宽高
var height = 400;
var innerRadius = width/2 * 0.6; //内半径
var outerRadius = innerRadius+5; //外半径 环宽度
var color20 = d3.scale.category20(); //颜色分类
/*初始化svg*/
var svg = d3.select("body").append("svg")
.attr("width", width)
.attr("height", height)
.append("g")
.attr("transform", "translate(" + width/2 + "," + height/2 + ")");
/*画弧*/
var outer_arc = d3.svg.arc()
.innerRadius(innerRadius) //内半径
.outerRadius(outerRadius); //外半径
var g_outer = svg.append("g"); //添加了环的组
g_outer.selectAll("path")
.data(groups)
.enter()
.append("path")
.style("fill", function(d) { return color20(d.index); })
.style("stroke", function(d) { return color20(d.index); })
.attr("d", outer_arc ); //添加环的布局模板
g_outer.selectAll("text")
.data(groups)
.enter()
.append("text")
.each( function(d,i) {
d.angle = (d.startAngle + d.endAngle) / 2; //在弧形区的一半
d.name = city_name[i];
})
.attr("dy",".35em")
.attr("transform", function(d){ //设定字体显示方位
return "rotate(" + ( d.angle * 180 / Math.PI ) + ")" +
"translate(0,"+ -1.0*(outerRadius+10) +")" +
( ( d.angle > Math.PI*3/4 && d.angle < Math.PI*5/4 ) ? "rotate(180)" : "");
})
.text(function(d){
return d.name;
});
var inner_chord = d3.svg.chord() //设定了布局
.radius(innerRadius); //设定了半径
/*添加弦*/
svg.append("g")
.selectAll("path")
.data(chords) //弦数据绑定
.enter()
.append("path")
.attr("d", inner_chord )
.style("fill", function(d) { return color20(d.source.index); }) //连线变色
.style("opacity", 0.4)
.on("mouseover",function(d,i){ //鼠标移入变色
d3.select(this)
.style("fill","yellow");
})
.on("mouseout",function(d,i) { //鼠标移出 变回去
d3.select(this)
.transition()
.duration(1000)
.style("fill",color20(d.source.index));
});
</script>
</body>
</html>