利用python做数据分析(五)-读取合并多个文件
pieces=[]
columns=["name","sex","births"]
for year in range(1880,2011):
path=("C:\Users\ecaoyng\Desktop\work space\Python\py_for_analysis\pydata-book-master\ch02\names\yob%d.txt" % year)
frame=pd.read_csv(path,names=columns)
frame["year"]=year
pieces.append(frame)
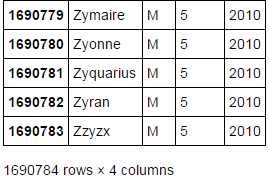
names=pd.concat(pieces,ignore_index=True)
namesnames将所有的数据整合到单个DataFrame中
- concat默认将多个DataFrame整合到一起
- ignore_index=True, 因为我们不希望保留read_csv所返回的原始行号
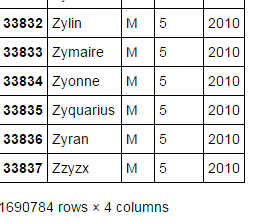
可以得到结果集为:
注意index的id,若不加ignore_index,则得到的结果集是
看出区别了吧。
利用groupby和pivot_table在sex和year级别上对其进行聚合了
table_births=pd.pivot_table(names,index=["year"],columns="sex",values=["births"],aggfunc=sum)
table_births.tail()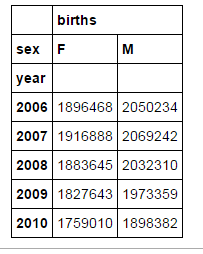
作图
table_births.plot(title="Total births by sex and year")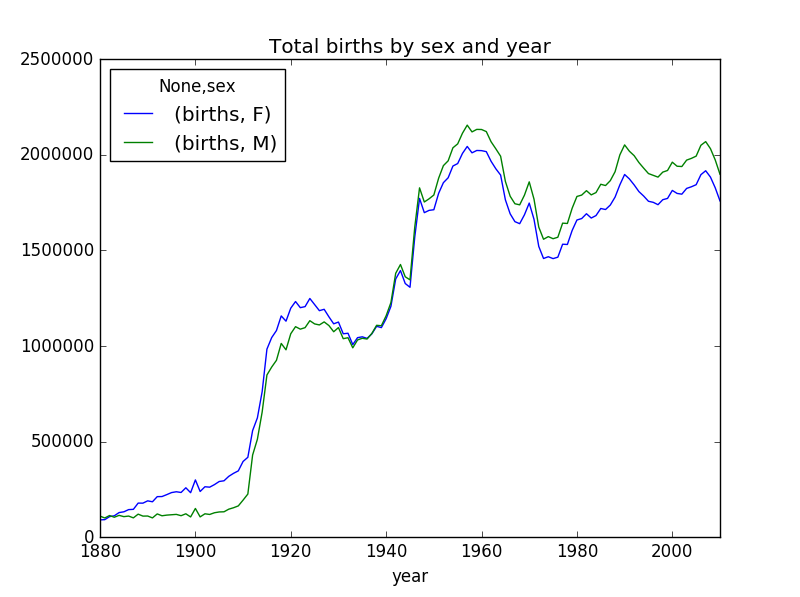
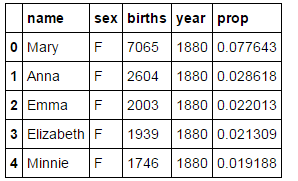
下面我们要统计百分比,再来看下原始的names:
接着groupby year
names.groupby(["year"]).births.sum()[:5]year
1880 201486
1881 192703
1882 221538
1883 216954
1884 243466
Name: births, dtype: int64
现在想男女分开看:
names.groupby(["year","sex"]).births.sum()[:5]year sex
1880 F 90993
M 110493
1881 F 91955
M 100748
1882 F 107851
下面来计算比例,并增加一列。astype的作用是类型转换。
def add_prop(group):
    births=group.births.astype(float)
    group["prop"]=births/births.sum()
    return group
names=names.groupby(["year","sex"]).apply(add_prop)
names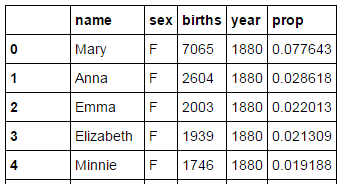
之后可以进行完整性认证,比如prop的和是否为1
np.allclose(names.groupby(["year","sex"]).prop.sum(),1)返回TRUE
现在我想取一个子集,比如year,sex groupby的头1000个
def get_top1000(group):
    return group.sort_values(by="births",ascending=False)[:1000]
grouped=names.groupby(["year","sex"])
top1000=grouped.apply(get_top1000)
top1000
男女的各自统计
boys=top1000[top1000.sex=="M"]
girls=top1000[top1000.sex=="M"]
制作透视表:
total_birth=pd.pivot_table(top1000,index=["year"],columns="name",values=["births"],aggfunc=sum)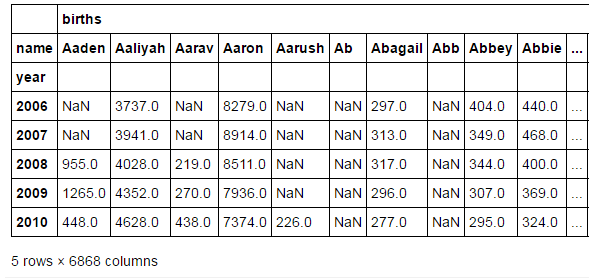
total_birth.births["John"]year
1880 9701.0
1881 8795.0
1882 9597.0
1883 8934.0
1884 9427.0
1885 8801.0
1886 9074.0
1887 8165.0
1888 9300.0
total_birth.births["John"].plot(title="John")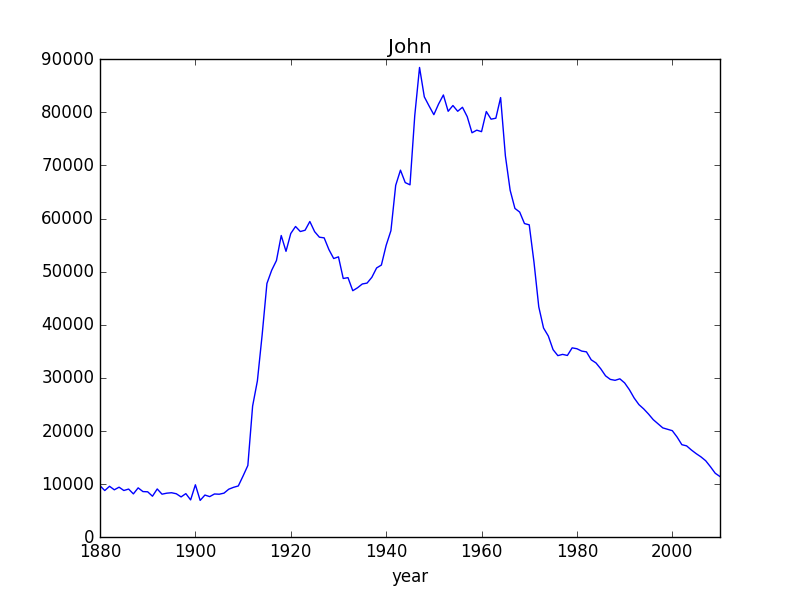
现在查看这最热的1000个名字所占全部名字的比例
table=pd.pivot_table(top1000,index=["year"],columns="sex",values=["prop"],aggfunc=sum)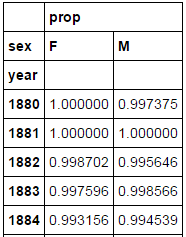
table.plot(title="Sum of table1000.prob by year and sex", yticks=np.linspace(0,1.2,13),xticks=range(1880,2020,10))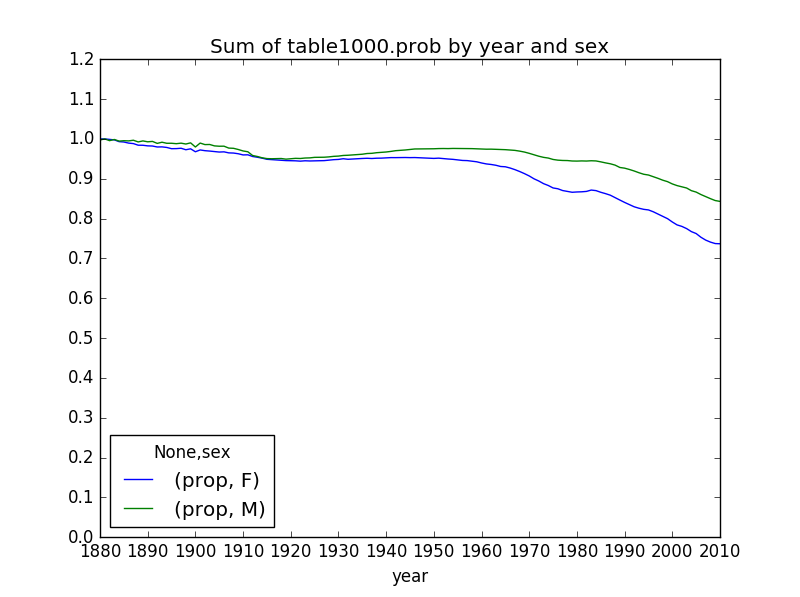
df=boys[boys.year==2010]
prop_cumsum=df.sort_values(by="prop",ascending=False).prop.cumsum()
cumsum是计算累计和
261874 0.842953
261875 0.843055
261876 0.843156
Name: prop, dtype: float64
prop_cumsum.searchsorted(0.5)array([116], dtype=int64),即最终结果是117
def get_quantile_count(group, q=0.5):
group=group.sort_index(by="prop",ascending=False)
return group.prop.cumsum().searchsorted(q)+1
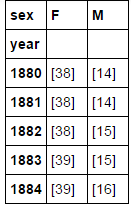
diversity=top1000.groupby(["year","sex"]).apply(get_quantile_count)
diversityyear sex
1880 F [38]
M [14]
1881 F [38]
M [14]
1882 F [38]
M [15]
1883 F [39]
M [15]
diversity.unstack("sex")